Execute proactive health checks and monitor the performance of your MongoDB databases. MongoDB usage is exploding. Its unique functionality offers benefits and poses challenges for today’s DBA. What if you could proactively manage the health of your MongoDB infrastructure while gaining deep insight into your distributed MongoDB architecture? What if you could efficiently share your findings with those who need that information using customizable dashboards and reports?
Foglight® for MongoDB can help centralize the management of cross-platform databases. It provides consistent alerting and notification workflows, real-time and historical diagnostics and reporting, as well as unmatched analytics of collected data. Implementing our MongoDB performance monitoring tool helps to ensure the health and performance of your entire database environment.Get quick access to health information, key performance metrics and critical alarms for all your database instances. Take immediate action to resolve performance issues on MongoDB servers and their host systems.
Easily track the number of current connections and the associated memory requirements. Receive alerts when the number of connections exceeds normal limits.
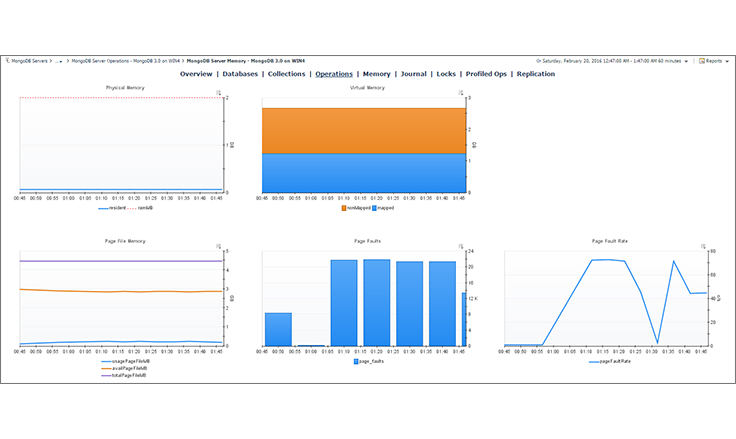
Review a robust set of MongoDB metrics that shed light on all aspects of memory utilization, including allocated memory and resident memory. Get alerts if allocated memory is insufficient to store all indexes, or is insufficient for peak performance.
Receive alerts when the number of page faults is high or increasing, so you can consider increasing allocated memory.
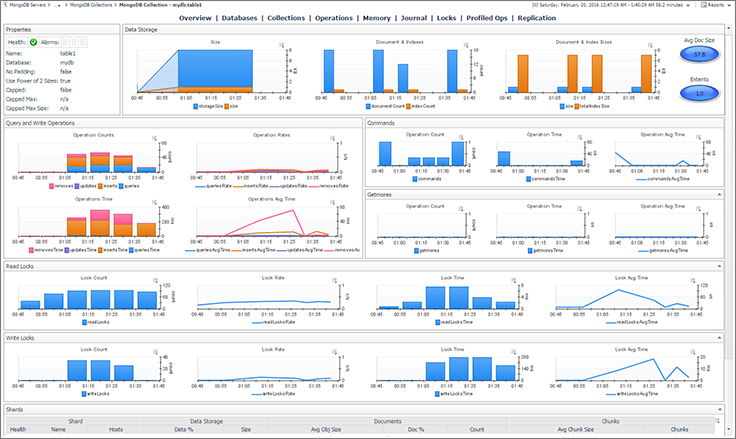
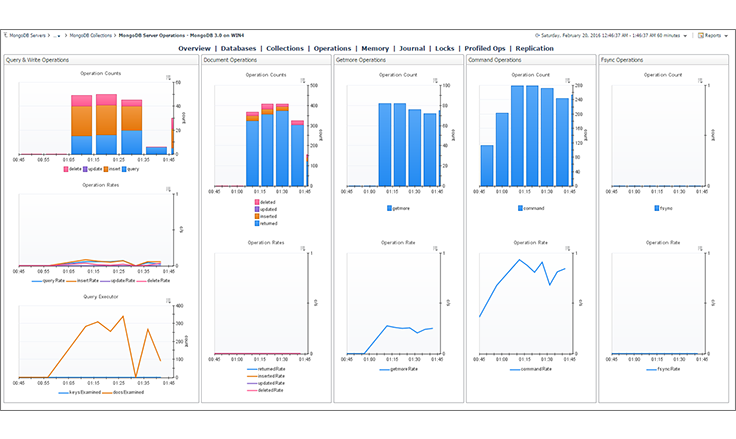
Track and analyze the load on your database with a complete set of database operation statistics, including details on replication lag and sharding.
Get comprehensive monitoring for all profiled operations, aggregated into groups for statistical analysis. Include your own queries in the aggregation. View operation-specific information by simply selecting a row. (This feature requires system profiling to be enabled on the MongoDB server.)
Automatically discover and monitor MongoDB replica sets, including member status, health, optime date and timeouts. Get alerts if members become unreachable or their status changes, and when optimes are out of sync.
Identify lagging in the sharding process and quickly troubleshoot the root cause, such as high lock percentages.
Ensure MongoDB resiliency by monitoring multiple metrics about commits to the journal, as well as background flushes and total time writing the data to disk.
Resolve MongoDB concurrency issues in record time with historical lock analysis.
Easily identify discrepancies by comparing node configurations against standard configuration templates, objects and historical data.
Avoid false alerts with adaptive Intelliprofile thresholds, which ensure alarms are only triggered when baselines are breached. Easily manage and annotate alarms, including scheduling blackouts for maintenance periods.
Speed problem resolution and discover chronic issues with embedded expert advice. Easily search your history of alarms and solutions.
Monitor hundreds of MongoDB database servers from a single management server.
Execute data collection through remote agents that ensure minimal overhead (no more than 2% CPU) is added to monitored database instances.
Ensure high-integrity data collection with frequent collections, or customize collection frequency to meet your business requirements.
Store historical monitoring data in the embedded data warehouse — without needing to purchase or install additional database instances for storage of monitoring data. External repositories can be leveraged in larger deployments.