Comprehensive performance monitoring, alerting, diagnostics and analytics. Quickly and easily detect, diagnose and resolve performance issues — wherever, whenever and however they occur. Foglight for Cassandra provides intuitive, web-based dashboards that alert you to emerging issues that might affect performance or availability. Having a clear, enterprise-wide view helps you optimize cluster performance, node availability, storage capacity, reads and writes, and latency across all your physical, virtual and cloud-based Cassandra database servers.
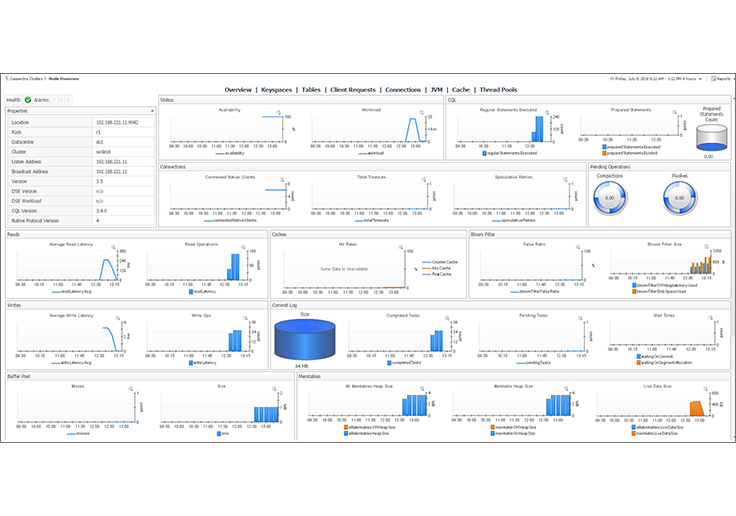
Foglight offers unattended 24x7 data collection. Its agentless architecture and minimal footprint ensure overhead is negligible on monitored hosts.Review all your Cassandra clusters from a single dashboard, including cluster structure, nodes, health status and key performance metrics. Drill down to expose details for any particular node.
See a comprehensive view of your nodes, with health, alarm, configuration and performance information sorted by category. Review granular information on any node, or compare performance across nodes in the same cluster.
Easily view all keyspaces in a cluster, for a selected node, or compare keyspaces across nodes. Quickly identify which objects are accessed most frequently, visualize read/write performance and diagnose latency.
View tables on a cluster or a node, along with aggregated performance information. Compare tables across different nodes with a single click. Receive alerts when performance counters deviate from baselines. Predict when additional capacity will be required.
Assess connection performance for all nodes in the cluster. Quickly identify nodes with the most dropped or large completed messages, along with other useful comparison metrics. Get alerts if timeouts occur, or if pending tasks create workflow bottlenecks.
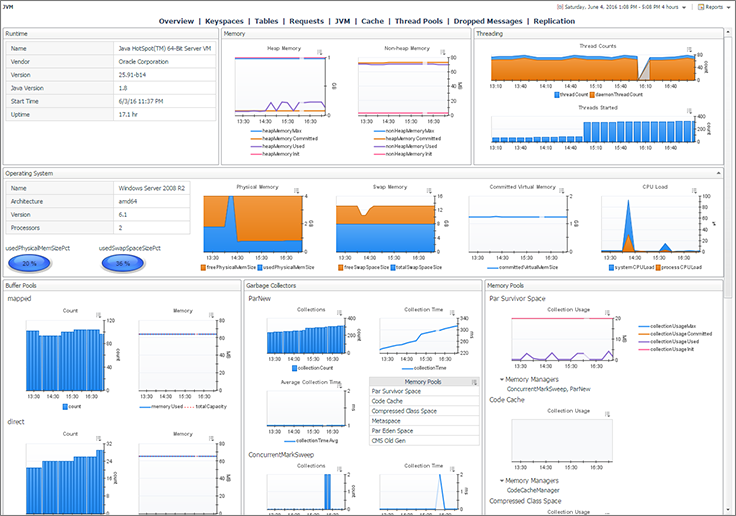
Understand the performance of Cassandra’s underlying JVM with easy-to-read metrics. Optimize garbage collection to avoid memory, throughput and response time problems.
View how quickly Cassandra is servicing client requests. Receive alerts when client request failures occur, or timeouts exceed normal rates.
Easily identify configuration discrepancies by comparing node configurations against standard templates or historical data.
See all changes made to a node during a given time period — even through restarts — and determine how each change might have impacted performance.
Avoid false alerts with adaptive Intelliprofile thresholds, which ensure alarms are only triggered when baselines are breached. Easily manage and annotate alarms, including scheduling blackouts for maintenance periods.
Speed problem resolution and discover chronic issues with embedded expert advice, along with easy search of your history of alarms and solutions.
Monitor hundreds of Cassandra database servers from a single management server.
Execute data collection through remote agents that ensure minimal overhead (no more than 2% CPU) is added to monitored database instances.
Ensure high-integrity data collection with frequent collections, or customize collection frequency to meet your business requirements.
Store historical monitoring data in the embedded data warehouse — without needing to purchase or install additional database instances for storage of monitoring data. External repositories can be leveraged in larger deployments.