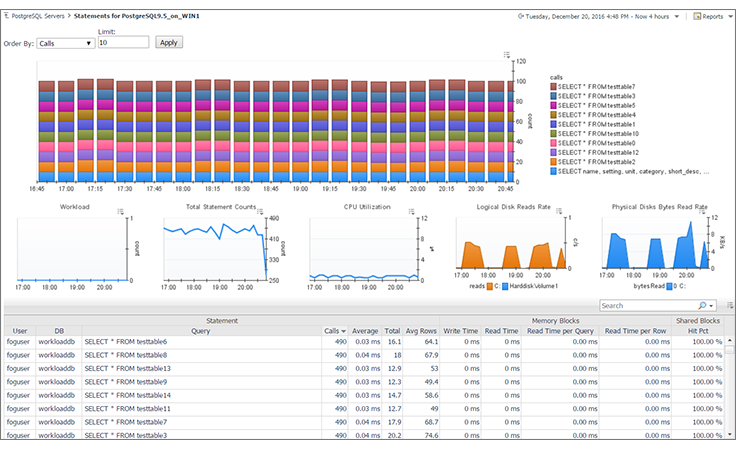
Easily narrow the scope of analysis and quickly pinpoint queries causing issues. Find, rank, and sort the highest impact queries that are causing performance problems.
Prevent database performance problems by monitoring write delays, which can limit the amount of memory in the shared buffer pool.
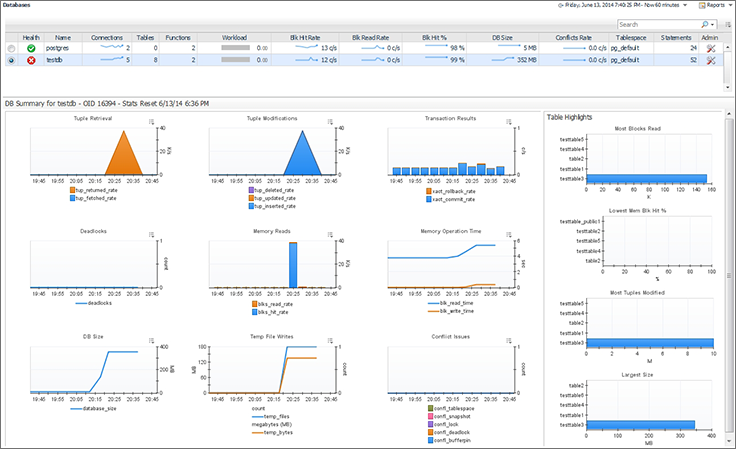
Analyze the behavior of critical PostgreSQL functions, including call rates, functions with the highest average self-time and functions with the highest average total time.
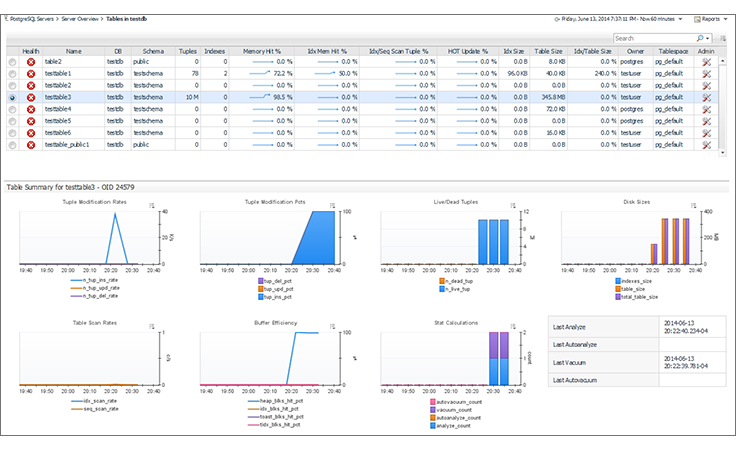
Quickly visualize all tables for a given database on a single screen, with table health, basic properties and calculated table-level operations. Understand if reads from table indexes are successfully sourced from buffer cache rather than physical disk, and see the percentage of tuples returned from index versus sequential scans.
Avoid false alerts with adaptive Intelli profile thresholds, which ensure alarms are only triggered when baselines are breached. Easily manage and annotate alarms, including scheduling blackouts for maintenance periods.
Speed problem resolution and discover chronic issues with embedded expert advice and convenient drill-down to granular details.
Monitor hundreds of PostgreSQL database servers from a single management server.
Execute data collection through remote agents that ensure minimal overhead (no more than 2% CPU) is added to monitored database instances.
Ensure high-integrity data collection with frequent collections, or customize collection frequency to meet your business requirements.